Ten tips for successful flow cytometry
Flow cytometry remains a critical technology for the high-throughput analysis of single cells in complex populations. Attention to good analysis practices is more important than ever due to the recent and dramatic increases in the number of markers we can simultaneously analyze as well as the move to spectral cytometry.
Immunologists and cell biologists have relied on flow cytometry since the 1970s to rapidly analyze large numbers of single cells derived from blood, immune tissues, cell culture and tumors. Flow cytometers analyze individual cells in a hydrodynamically focused liquid stream, using lasers and sensitive detectors to measure cell size and optical density. Cellular proteins, structures and physiological states are analyzed using fluorescence detection.
The earliest instruments analyzed laser light scattering of cell size and internal complexity (still important parameters) and a handful of fluorescent markers, allowing early elucidation of the organization of the immune system. Modern flow cytometers can now detect 40 or more fluorescent markers simultaneously, facilitating precision analysis of complex cell mixtures. The high-throughput nature of flow cytometry enables millions of individual cells to be rapidly analyzed, permitting the detection of rare cell populations and the identification of new cell subsets.
Increasing marker and cell number have moved flow cytometry into the realm of ‘big data’, requiring the same probability state analysis tools already in use in genomics and proteomics. Gone are the days when one- and two-parameter data plots sufficed for cytometry analysis; parameter reduction techniques and unsupervised computer analysis are now the norm for many cytometry applications.
Flow cytometry has also advanced on other fronts. Image cytometry (where imagery is captured as a parameter) has advanced steadily, both in slide-based and stream-based systems. Spectral cytometry, allowing the capture of full spectra for both individual fluorescence quantitation and separation of spectral overlap via spectral deconvolution, is rapidly becoming a mainstream technology. Spectral cytometry allows the analysis of multiple fluorochromes with closer spectral properties than traditional technology, increasing the number of markers measurable in a single sample with improved spectral separation.
Specialized cytometers for both large and small objects are now available. Objects as large as Drosophila embryos and C. elegans and as small as exosomes can now be analyzed on optimized platforms. A good understanding of your experimental system, sample preparation, instrument technology and post-acquisition analysis are all critical for the successful application of flow cytometry in your research.
The recommendations for implementing flow cytometry in your research are no different than for any other biomedical technique.
Ten tips for flow cytometry data acquisition and analysis
Tip 1: Know your instrument!
In the past, flow cytometers were only available from a few manufacturers. There have never been more flow cytometry systems available than there are now. Some are designed for more basic analysis, with small numbers of lasers and detectors, whilst high-end research systems may have many laser sources and numerous detectors. Choose the right system for your application. If you need to excite specialized fluorescent probes and proteins, make sure your system has the correct laser wavelengths (such as a yellow laser for red fluorescent proteins). High-dimensional cytometry requires high-dimensional instruments; simpler applications will be better served by simpler (and lower-cost) systems.
Tip 2: Good system maintenance and quality control
Flow cytometers require a complex interplay of lasers, optical alignment and detectors, and require daily quality control to monitor changes in performance that can dramatically affect data quality. Follow the manufacturer’s recommendations and use their tools to monitor instrument performance, which is usually a mixture of fluorescent particles with known properties. Practices like detector ‘voltration’ to establish good ranges for your instrument detectors are highly recommended, as well as siting instruments in a shared resource laboratory or core facility with trained staff!
Tip 3: Sample preparation
As with any laboratory technique, data acquisition and analysis are only as good as the quality of the sample. Flow cytometry requires single-cell suspensions with minimal debris and cell clumping. Fluorescent probes need to survive any sample preparation steps including cell permeabilization and fixation; this is especially true of expressible fluorescent proteins. Cell viability markers are critical elements of any flow sample and are often not included in multicolor panels. Dead cells can non-specifically bind conjugated antibodies and have considerable autofluorescence; they need to be excluded from any viable cell labeling (unless you are interested in apoptosis). Samples should be filtered to remove clumps immediately prior to acquisition.
Tip 4: Good panel design
Multicolor flow cytometry requires the design of fluorescent probe panels, which can become very complex as labeling extends into the high-dimensional realm. Compatible probe combinations need to be chosen, taking into account the spectral properties of the dyes, the density of a particular marker in the cell and the relationship between markers. For example, low-density markers should be labeled with bright fluorochromes. Mutually inclusive markers should be assigned to fluorescent probes with dissimilar spectral properties to minimize the effects of spectral overlap. Get expert advice or use panel design tools to build robust panels and test them extensively prior to actual data collection.
Tip 5: Prepare and use good setup controls
Setup controls include single-color compensation or spectral deconvolution controls, which are necessary for multicolor analysis. While these are not experimental controls, they are nevertheless essential for multiparametric analysis. Choose an appropriate system (the actual cells in your experiment, another cell type or antibody capture beads) and test them thoroughly. The intrinsic autofluorescence in your system is important for all flow cytometry but especially for spectral, where it can contribute to and complicate your analysis. Use deconvolution controls with similar properties to your intended cell type.
Tip 6: Prepare and use good experiment controls
Experimental controls are those necessary for data analysis, including isotype-matched antibodies and fluorescence-minus-one (FMO) or all-but-one (ABO) controls. It was once common to use isotype-matched antibodies to assess non-specific labeling (same isotype and conjugated fluorochrome) but now see less use due to the complexity of high-dimensional panels and their often unpredictable binding behavior. However, they are still sometimes used in situations where non-specific antibody binding is a concern. FMO and ABO controls (where a particular marker is absent, but all others are present) are very important in assessing the labeling of dim and modulated markers. While not necessary for every marker, well-selected FMO and ABO controls are necessary for any multicolor experiment.
Tip 7: Data acquisition
While you can reanalyze your data many times, there will be only one acquisition! Make it count!
Make sure your instrument detectors are set correctly. Pre-acquire your samples to ensure scatter and fluorescence settings are on-scale and correspond to the recommended ranges for your instrument. Many modern systems use detectors locked to optimal voltages and gains or have recommended settings for your particular detectors, use these if possible.
Save a statistically valid number of events! Setting a minimum collection number based on a gated region is highly recommended but save everything. Enter all experiment information into the actual data files, including marker names and sample information. The almost universal flow cytometry data file standard (FCS) makes this easy. Make sure all controls (setup and experimental) are run and saved. When in doubt, ask for help.
Tip 8: Data analysis
Cytometric data analysis is now often done using third-party analysis software rather than acquisition software, of which there are many options. Become proficient in your preferred software system and make full use of your setup and experimental controls. High-dimensional analysis requires migration to probability state analysis packages. Use unsupervised analysis tools (such as auto-gating and parameter reduction) for high-dimensional analysis but ‘look under the hood’ to monitor software-driven operations. Don’t be afraid to ask for assistance! Like genomics and proteomics, high-dimensional analysis is complex and has evolved into a bioinformatics subspecialty with its own experts. Companies that consult in high-dimensional data analysis (often with their own tools) are now available.
Tip 9: Data archiving
Like in any technique, securely archive your data. This can be done on physical media but should also be done on remote cloud-based systems. Many institutions now require this and offer computing resources for this purpose. Most scientific publications also require your data to be deposited in a secure available location such as FlowRepository for subsequent review and post-publication data reanalysis.
Tip 10: Data presentation
The same rules for presenting most scientific data apply to flow cytometry. Use clear figures and axis labels on your data plots, and don’t rely on the labels of your cytometry software (which are usually small and cryptic). Make your figures understandable without reference back to a figure legend. While sometimes necessary, single-parameter histograms are not as informative as two-dimensional dot and density plots. Clearly indicate all techniques used in parameter reduction figures. The figure below on the left shows many common mistakes in cytometric data presentation, including overreliance on analysis software, default shading and text, inappropriate axis scaling, and cryptic or absent axis and identifying labels.
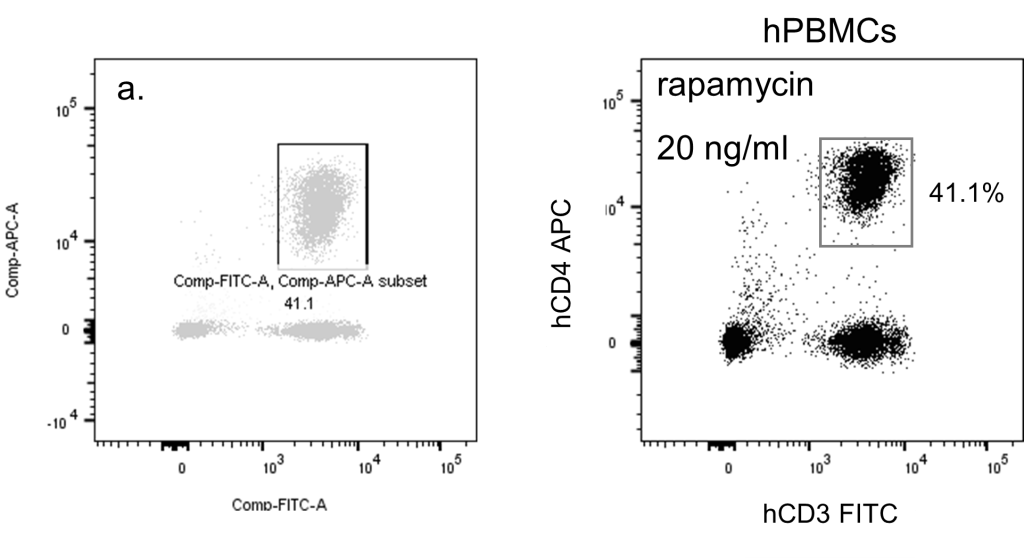
Left: A two-parameter plot with many problems. Right: A plot with better scaling, appearance and annotations.
The wide variety of flow cytometry systems available today is exciting but can be confusing to the new user. When buying or searching for a system, choose an option appropriate to the intended applications and experiment scale. Small objects like micro-vesicles and exosomes are at the minimum threshold of what conventional cytometers can detect; many cytometers intended for conventional cells do not analyze these samples well. If running these samples, choose a system with a good track record for small object analysis, or a system specifically designed for this purpose. Fluorescence-activated cell sorters are necessary for cytometry-based cell separation but often do not make good routine analyzers.
Choose the right instrument, spend enough time on sample preparation and panel design, put thought into data acquisition parameters and make full use of the wide variety of available analysis tools to get the most out of flow cytometry.
- Chattopadhyay PK, Gaylord B, Palmer A et al. Brilliant violet fluorophores: A new class of ultrabright fluorescent compounds for immunofluorescence experiments. Cytometry A 81A(6), 456-466 (2012).
An example of the new polymer fluorochromes allowing expansion of high dimensional flow cytometry. - Cossarizza A, Chang H-D, Radbruch A et al. Guidelines for the use of flow cytometry and cell sorting in immunological studies (second edition), Eur. J. Immunol. 49(10) 1457-1973 (2019).
An extensive review of flow cytometry techniques, frequently updated. - Maciorowski Z, Chattopadhyay PK and Jain P. Basic multicolor flow cytometry. Curr. Protoc. Immunol. 117(1), 5.4.1– 5.4.38. (2017).
A good introduction to multicolor flow cytometry. - Mahnke YD and Roederer M. Optimizing a multicolor immunophenotyping assay. Clin. Lab. Med., 27(3) 469-485 (2007).
Critical parameters for multi-color analysis. - Melamed MR, Lindmo T, Mendelsohn MI Flow cytometry and sorting, 2nd Edition, John Wiley and Sons, NY, USA (1990).
A comprehensive review of the underlying technology of flow cytometry. - Shapiro HM and Telford WG. Lasers for flow cytometry: current and future trends. Curr. Protocols in Cytometry 83(1) 1.9.1 – 11.9.21 (2018).
A comprehensive overview of lasers in flow cytometry. - Shapiro HM. Practical flow cytometry, 4th Edition, John Wiley and Sons, New York, NY. (2003).
A wonderful introduction to flow cytometry both past and present, including many technical details of instrument operation. Out of print but available for free online.
About the Author
 William Telford is a Senior Associate Scientist in the National Cancer Institute’s Flow Cytometry Core Laboratory (NIH; MD, USA). Telford received his PhD in microbiology from Michigan State University (MI, USA), where his laboratory developed some of the earliest techniques for flow cytometry detection of apoptosis. Since then, Telford has continued working in flow cytometry and is the co-founder and coordinator of the NIH Flow Cytometry Interest Group and a faculty member in the Indo-US Flow Cytometry Workshop program, where he teaches flow cytometry methods at many biomedical institutions in India.
William Telford is funded by intramural research resources from the National Cancer Institute, National Institutes of Health, U.S. Department of Health and Human Services and has no identified conflicts of interest with the contents of this article.