Ten tips to prepare images for presentation

It is critical for scientific integrity that images in posters, papers and talks are accessible for a wide audience. Here’s our fool-proof guide to ensure your images are perfect each time.
Images in life science and medical publications document specimens and tissues, visualize structures invisible to the eye, and show variations among cells or objects. In addition, images are increasingly used to quantify observations and are re-analyzed by researchers to test tools or differing hypotheses. Scientific images have been around for centuries, long before the era of photography and light microscopy.
The first scientific images were drawings in medical and pharmaceutical textbooks that showed all specimens clearly aligned and size-standardized. While these images to today’s viewer may seem like pieces of art, the drawings (and later the engravings) were not depicting individual specimens, but an ‘average’ specimen of many observations [1] [2]. The invention of photography, and in particular digital photomicrography, led to a steady increase in the number of image figures in scientific articles. Today 20% of the articles indexed in PubMed contain image figures and in the 10–15 minutes you spend reading this article, 5 new publications with images will appear, which adds up to around 200,000 per year [3].
Current image problems
The quality of these images is highly variable, with problems ranging from non-legible images to manipulated images. Image manipulation can involve intentional changes that mislead audiences and fabricate results; however, image manipulation also often occurs accidentally when images are processed improperly, for example by non-expert use of specialized software. The rate of demonstrably intentional image manipulation is luckily rare, but erroneous image handling is more prevalent [4] [5]. Image manipulation is at the center of guidelines and image quality initiatives by scientists and journal editors [5].
Legibility of image figures has only surfaced as an issue more recently (Figure 1, below). An initiative I co-led systematically investigated the legibility of already published images in biomedical sciences [6]. We analyzed if images were accessible for different audiences and whether key annotations, required for all scientific images, were included. This uncovered that 30–50% of images were not colorblind friendly and the color annotations in around 20% of images were not color blind safe. This means that colorblind readers would be unable to see or understand the key scientific messages contained in the image.
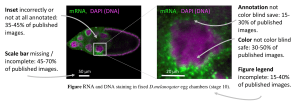
Figure 1: D.melanogaster egg chamber stained for DNA and a specific mRNA. Aspects of images that in current publications are often problematic, and do not meet good scientific standards, are highlighted
Data: [6], Image: [12].
Also problematic were non-annotated insets, which show a region of interest in an enlarged view, and a general lack of explanation for annotations (symbols, arrows) and samples shown. Furthermore, and possibly most unexpected, many images in publications lack sufficient information on scales, something that is often taught as early as high school. Scale information, such as scale bars, or an indication of magnification or image size, was entirely missing in 10–30% of the papers and incomplete in another 30–40% [6].
Taken together, only a fraction of the published images – 10–20% – are fully accessible and interpretable to audiences [6] and further, many papers insufficiently report image acquisition and processing techniques [7]. Undergraduate and graduate curricula do not offer courses in image acquisition, ethical processing, and visualization. Additionally, microscopy courses excellently teach technical aspects of image acquisition and image analysis, but often omit image communication. I have therefore compiled 10 tips for preparing legible images.
10 tips for image preparation
Tip 1: Make a copy
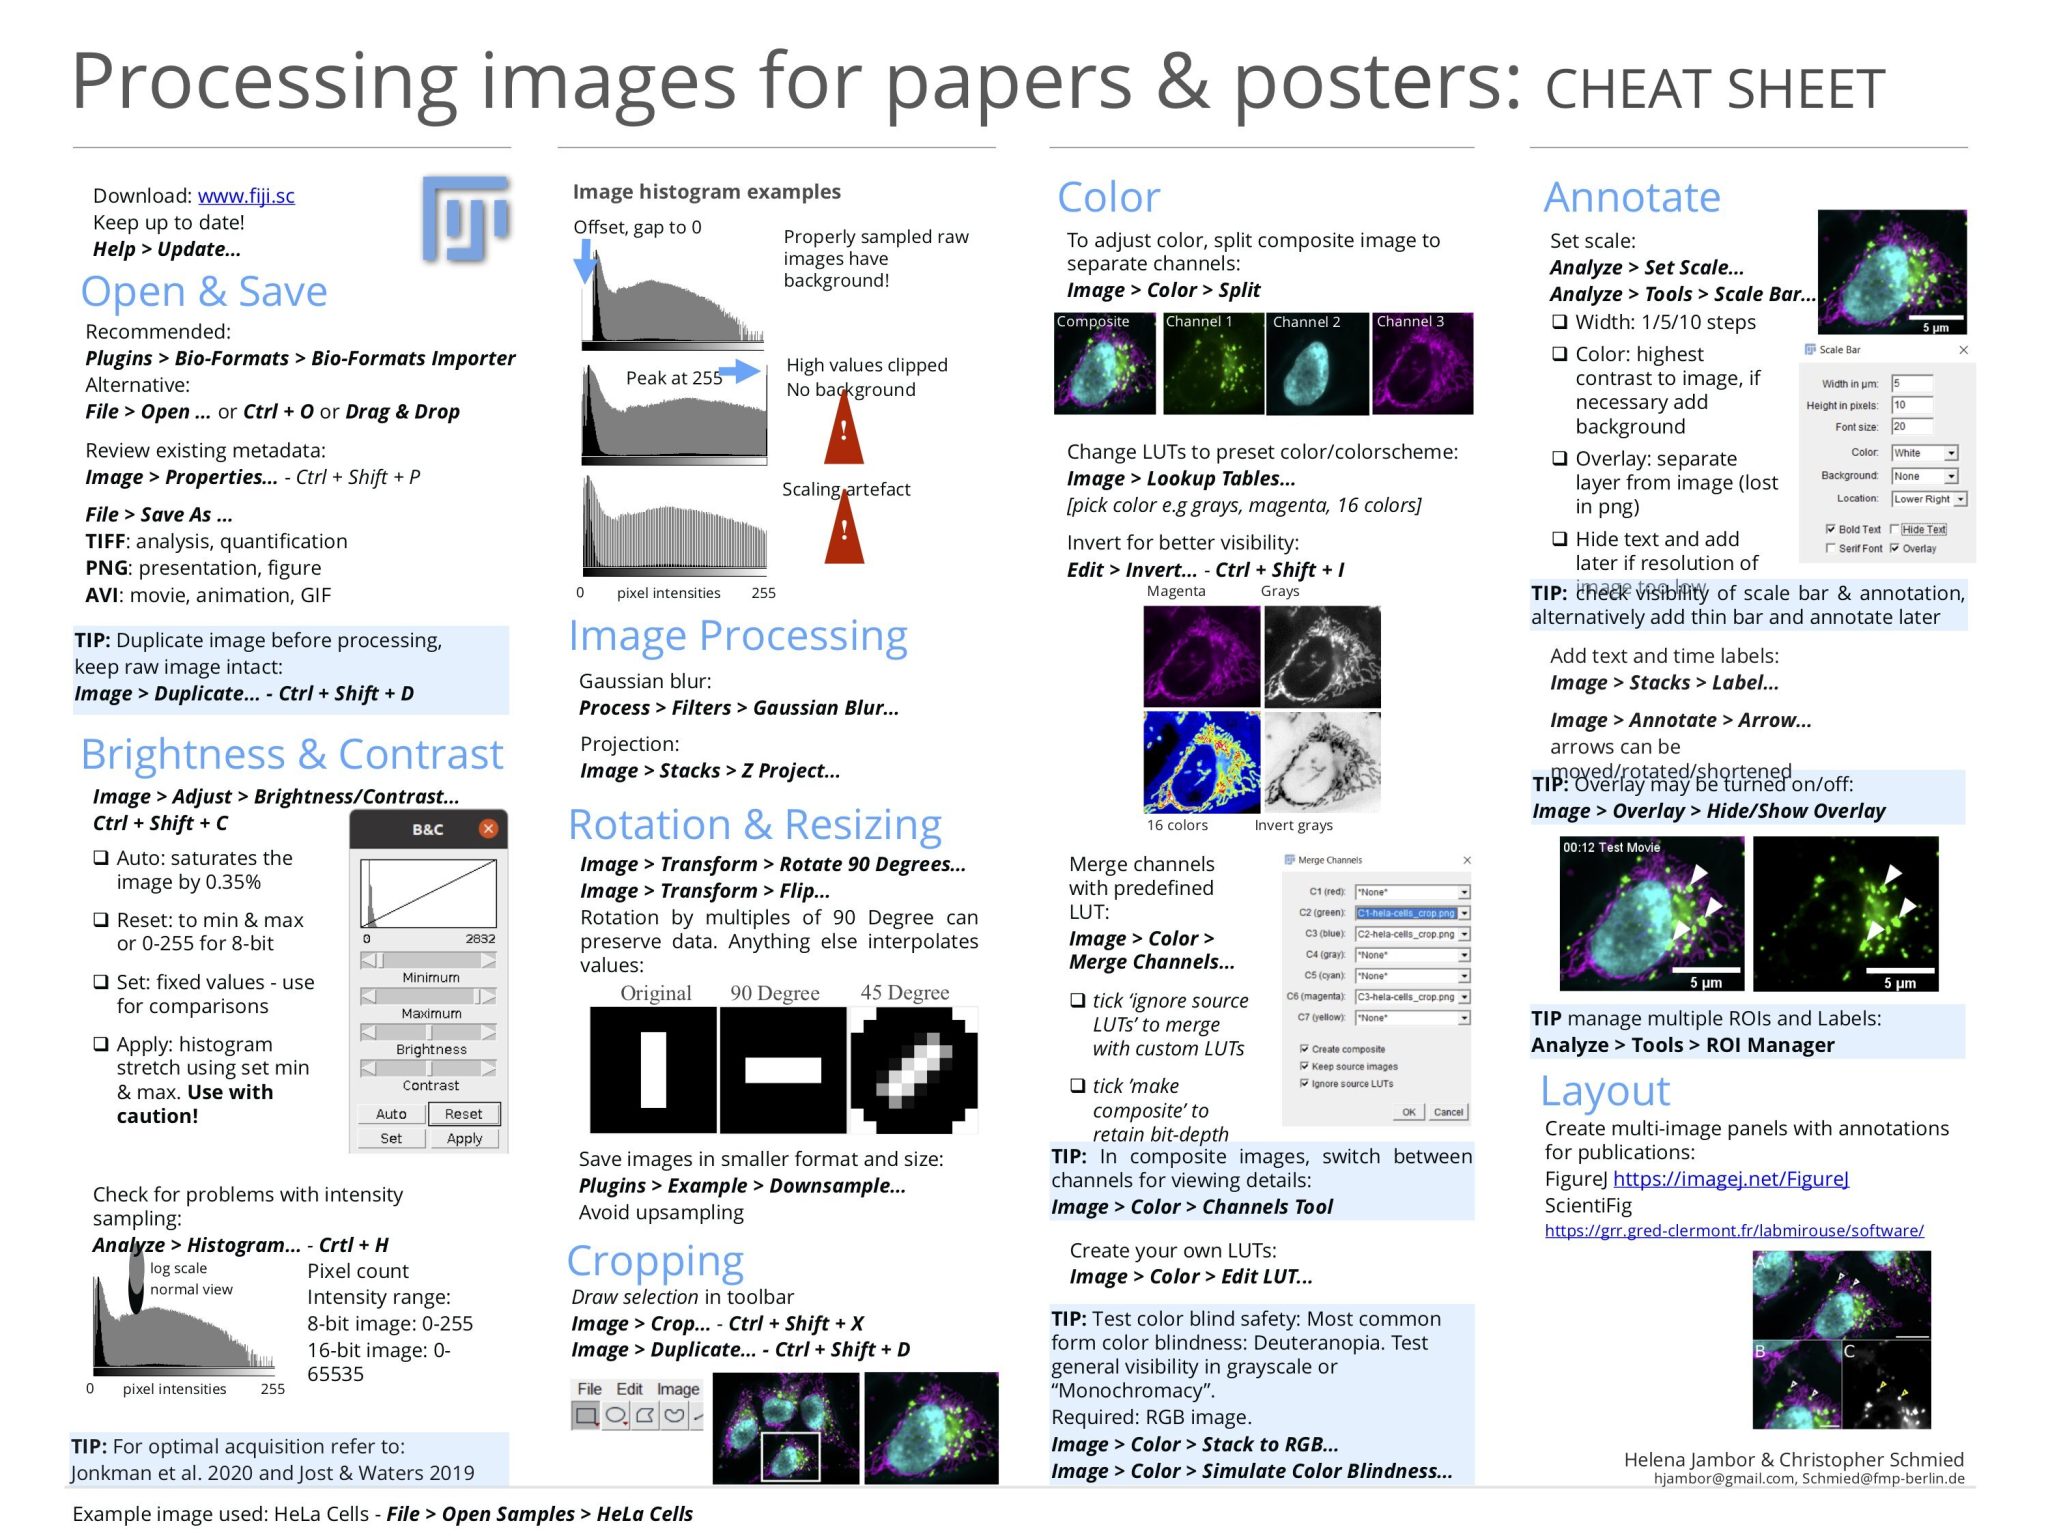
Always create a copy of the original microscope or image file, which can then be used for any processing and adjustments. The original image file, usually a TIFF, will usually be requested by a journal editor with questions about the processing steps. The original image file can also be uploaded to a public image archive for access by the wider scientific community.
Tip 2: Adjust images with caution
Scientists often adjust the brightness and contrast of images. To allow quantitative comparisons of several images, fixed intensity values should be used, and novice users should only apply linear adjustments that are applied to the whole image. Image rotations must be done with care, as in digital images this redistributes image intensity values, with most software increments of 90 degrees pixels can be reordered rather than interpolated, which maintains the intensity distribution (See also: [8, 9]. And it should be obvious that enhancing, obscuring, removing or replacing image parts constitutes image manipulation [5]
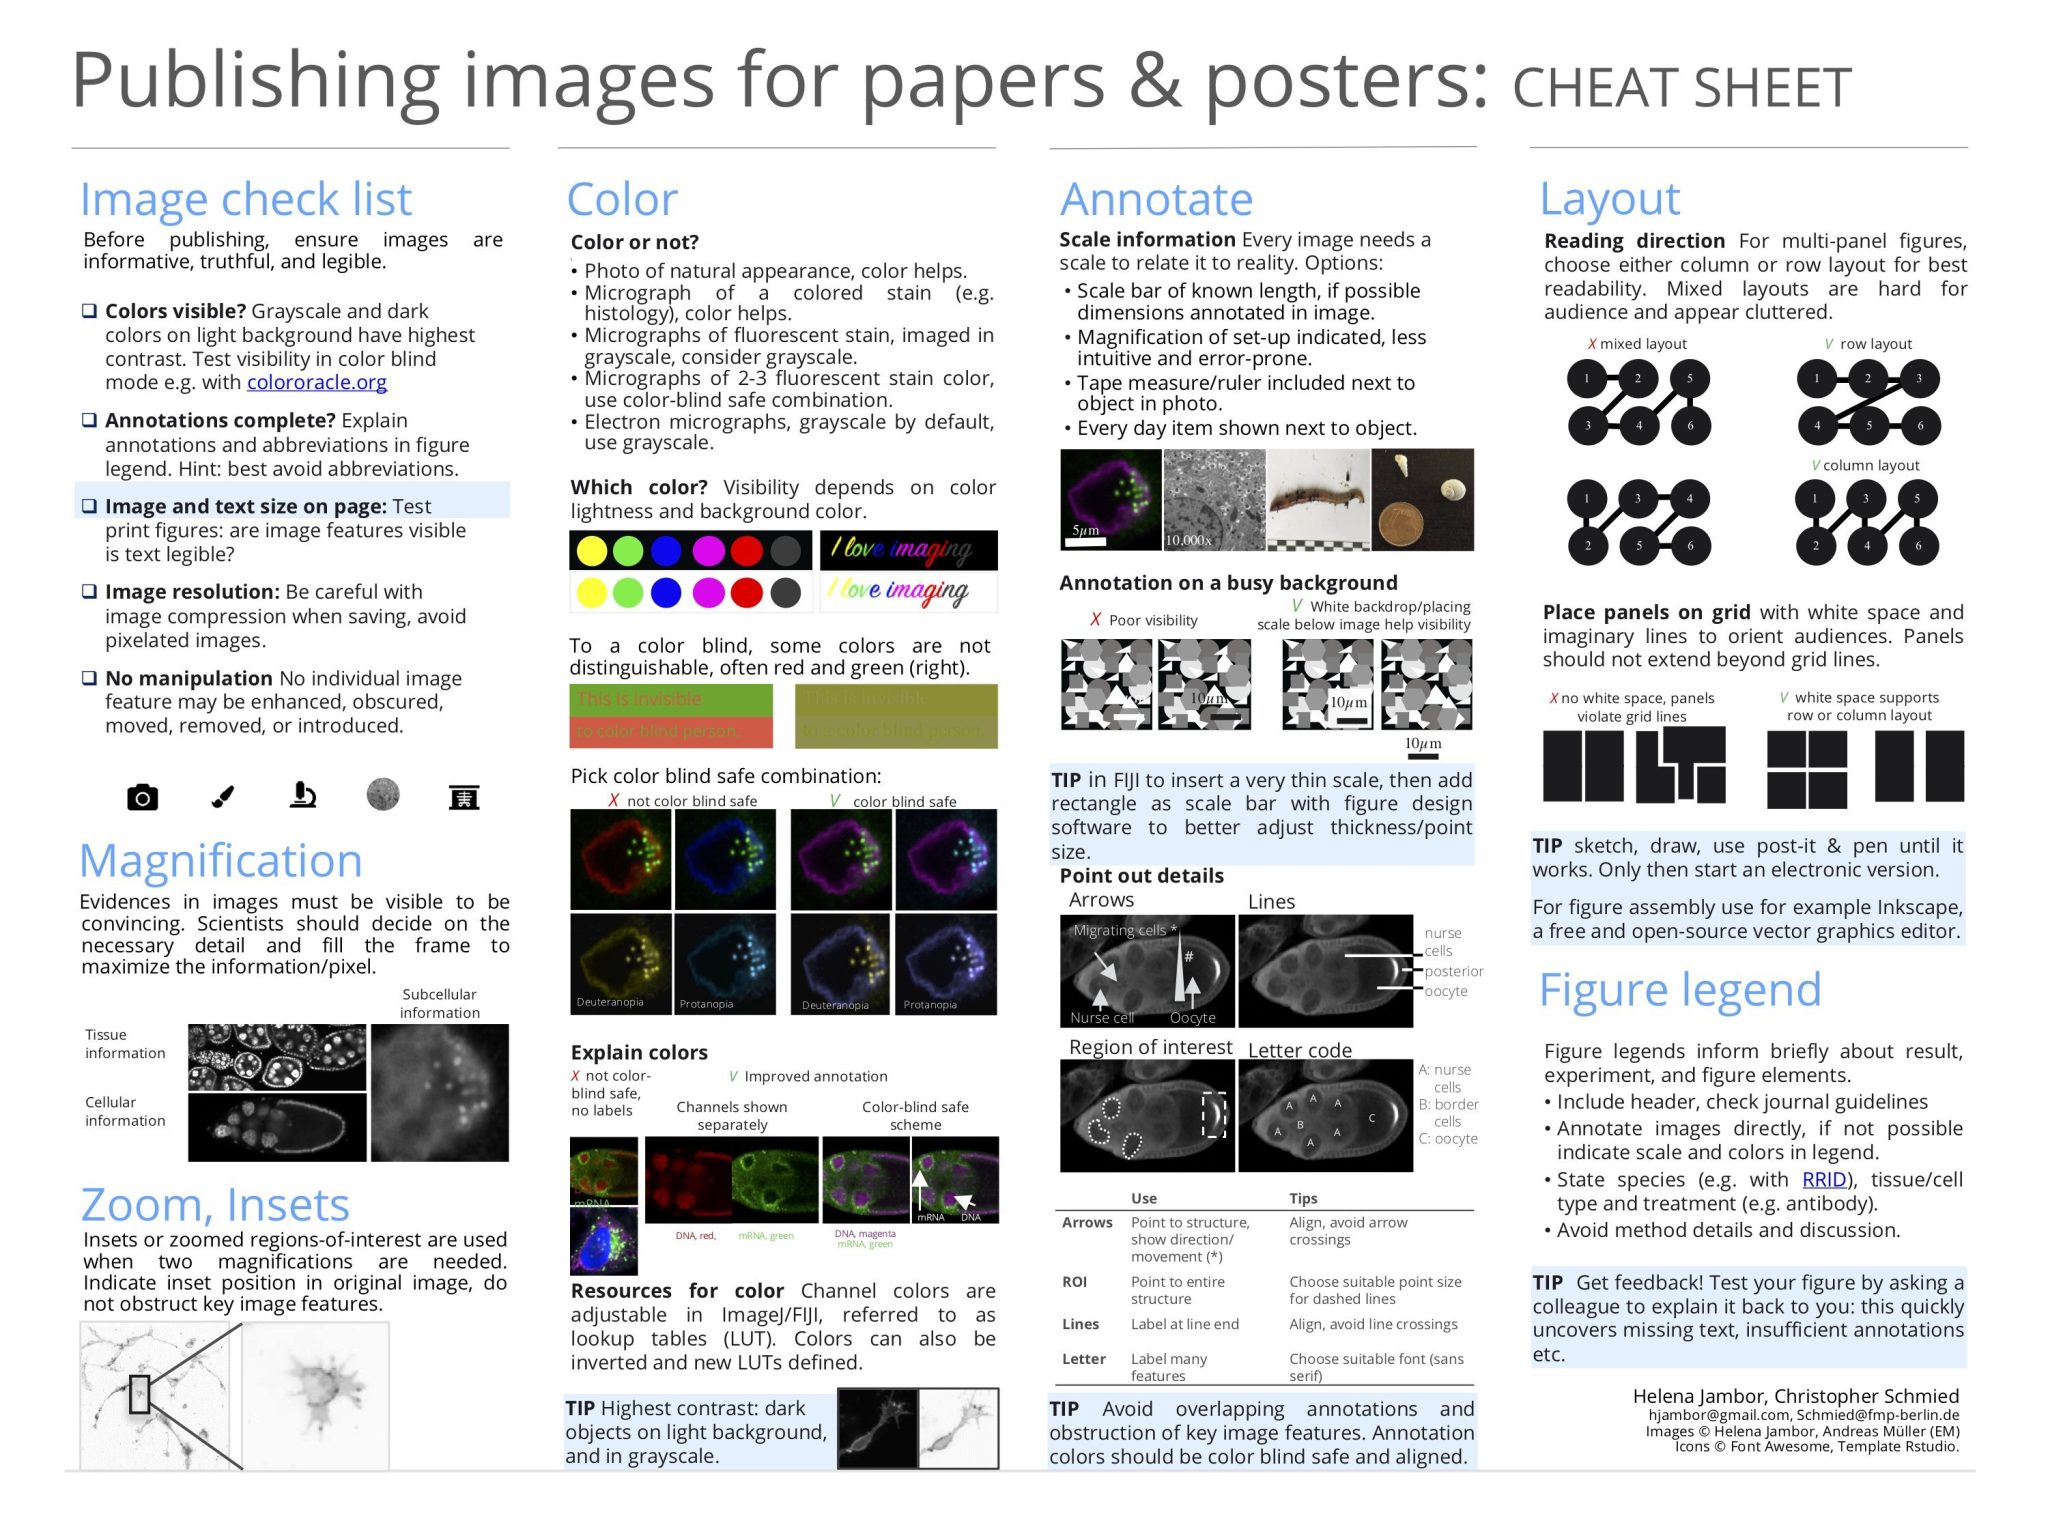
Tip 3: Consider magnification of key features
Scientists should consider the final size of the image on the page: are the features that matter visible? Might it be better to show the image in larger size? Alternatively, consider enlarging and cropping the image to focus the reader on your key result, or even show the original image and an image detail (inset) side by side. If insets are used, indicate their position in the original image with a “region of interest,” for example (see Tip 8).
Tip 4: Choose colors with good contrast
When showing colored photos, histogram stainings, or clinical images, it is often not possible to make color adjustments as the images are shown in full color. Many fluorescent microscopes, however, capture each wavelength (‘channel’) in separate grayscale images, allowing scientists to adjust the display colors (‘lookup tables’). When showing one channel, choose a display color that has the best contrast on the background color, for example blue on black has a very low visibility, while white has good visibility on a black background. Also consider inverting the signal and background, as humans can differentiate dark signals on a bright background.
Tip 5: Visibility for color-blind audiences is important
When combining several color channels, consider the visibility for colorblind audiences. The most common type of colorblindness is a difficulty distinguishing red from green, but other combinations may also be problematic. Color combinations and their visibility to diverse audiences can be tested with online software or the desktop application Color Oracle. While options exist for two channels, it is almost impossible to combine three or more channels in a colorblind-friendly manner. In this case, consider showing each color channel with a separate image.
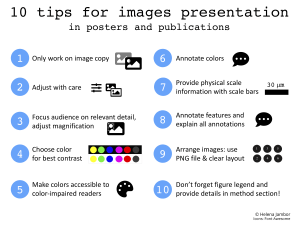
Ten tips for images presented in posters and publications.
Icons: Fontawesome.com
Tip 6: Annotate colors and images
Colors and images are not self-explanatory. It is therefore essential to explain all colors used in the figure (and do so in a colorblind-safe mode!). This may be done with colored text overlaid with the image. While some journals want annotations below the image or in the figure legend, I like to stress that understanding an image is easiest if annotations are very close by.
Tip 7: Don’t forget the scale!
Every scientific image needs scale information. Scale information should ideally be provided with a scale bar with the dimensions placed on top. Alternatives may be an annotation of the entire image width or a scale bar with the dimensions stated in the figure legend.
Tip 8: Annotate features clearly
Lines, arrows, symbols and regions of interest are used to point out important details or areas in an image. It is essential that all annotations are distinguishable and clearly explained. Avoid using similar annotations for diverse meanings in the same image: do not use the same arrows for both pointing to a feature and indicating a motion.
Tip 9: Prepare thoroughly for publication
After completion of image preparation (‘image processing’), the image file may have to be converted from TIFF to a format that is compatible with figure and poster preparation software (like Inkscape or PowerPoint), such as PNG. Be aware, that in PNG, format image channels and annotations are irreversibly merged. Due to its lossy compression, JPG should not be used for scientific images.
Ensure that the scale bar and all annotations are legible in the final image figure. It may be more time efficient to include labels and annotations only in the figure preparation software.
When showing several images in one figure, pay attention to the layout and reading direction: arrange images either in several rows or columns and ideally label individual images (A, B, C etc.).
Tip 10: Figure legends are not optional
They provide details on the specimen, the preparation methods, the dyes used for staining etc. An image with its figure legend should be self-explanatory to an expert audience. Additional details, long preparation methods, imaging set-ups etc. should be explained in the methods section of a manuscript and may be left out of most posters.
Go further: improve your image quality
A detailed collection of poor and improved image examples is provided in our meta-analysis [6]. These are intended for teaching purposes and may also be repurposed and reused from the open OSF framework.
If your project involves many images and you collect quantitative data, you should familiarize yourself with professional image processing software. We prepared a workflow with the open-source software FIJI/ImageJ [10]. Novice microscopy users are instructed with a step-by-step image processing workflow [11]. The advantage of using FIJI/ImageJ is that users can create scripts to adjust image processing to their own needs and even write software extensions (‘plugins’) themselves. Note that for publishing reproducible scientific data, it is essential that all image processing steps must be clearly explained and if a new software code was used, the code must be available alongside your publications.
In conclusion, legible images are a hallmark of scientific integrity and ensure that our data is also decodable to future generations. It is critical that we prepare images with care and that they are fully self-explanatory. If we show incomprehensible images, we reduce our ability to communicate our results and to disseminate our scientific findings. In the long run, unintelligible images will also not be included in the scientific canon and, in the worst case, will even undermine confidence in the data.
Want more tips for image preparation and presentation? Check out these downloadable, posters today!

Helena Klara Jambor
Mildred Scheel Early Career Center, TU Dresden (Germany)
Financial disclosure/Acknowledgements
HKJ is funded through the Deutsche Krebshilfe. I would like to acknowledge all co-authors of the PLOS Bio paper describing our analysis of image publication.